
Integrating ARIMA and GARCH Components within Recurrent Neural Cells for Enhanced Time-Series Prediction
Keywords:
machine learning, deep learning, stock price prediction, financial modelling, rime-series forecastingAbstract
Background and Objectives: Financial time-series forecasting remains challenging due to the complex interaction between linear dependencies, nonlinear temporal patterns, and time-varying volatility in financial markets. Traditional statistical models such as Autoregressive Integrated Moving Average (ARIMA) and Generalized Autoregressive Conditional Heteroskedasticity (GARCH) provide interpretable representations of linear dynamics and volatility clustering but often struggle to capture nonlinear relationships in high-frequency data. Deep learning approaches, particularly Recurrent Neural Networks (RNNs) and Long Short-Term Memory (LSTM) models, can learn nonlinear sequence representations but typically rely on implicit feature learning without incorporating established statistical structures. Most hybrid approaches use pipeline-based integration, where statistical features are computed externally and fed into neural networks, limiting interaction between statistical structure and neural dynamics. This study develops a unified forecasting framework that integrates classical time-series operators directly within recurrent neural network cell dynamics, enabling joint modeling of temporal dependencies, nonlinear sequence dynamics, and time-varying uncertainty within a single end-to-end trainable system.
Methodology: This study proposes a statistically augmented recurrent forecasting framework in which classical statistical operators are embedded directly into the hidden-state transitions of recurrent neural network architectures. Six hybrid models are developed by integrating ARIMA and volatility-based components into both RNN and LSTM structures, resulting in ARIMA–RNN, Volatility–RNN, GARCH–RNN, ARIMA–LSTM, Volatility–LSTM, and GARCH–LSTM architectures. In these models, statistical coefficients are treated as trainable parameters and jointly optimized with neural network weights using backpropagation through time, enabling unified end-to-end learning. Empirical evaluation is conducted using intraday financial data sampled at five-minute intervals from seven highly liquid U.S. technology stocks commonly referred to as the "Magnificent Seven": Apple, Microsoft, Amazon, Alphabet, Meta, NVIDIA, and Tesla. Each observation includes open, high, low, close, and trading volume variables (OHLCV). Time-series forecasting is formulated using a sliding-window approach with a look-back window of 30 time steps. The dataset covers the period from January to September 2025 and is chronologically divided into training and testing sets using an 80/20 temporal split to avoid look-ahead bias. Time-series cross-validation with an expanding window strategy is used for model evaluation. Forecasting performance is assessed using Root Mean Squared Error (RMSE) and Mean Absolute Percentage Error (MAPE), and statistical significance is evaluated using the Scheirer-Ray-Hare test within each architecture group and Wilcoxon signed-rank tests between groups.
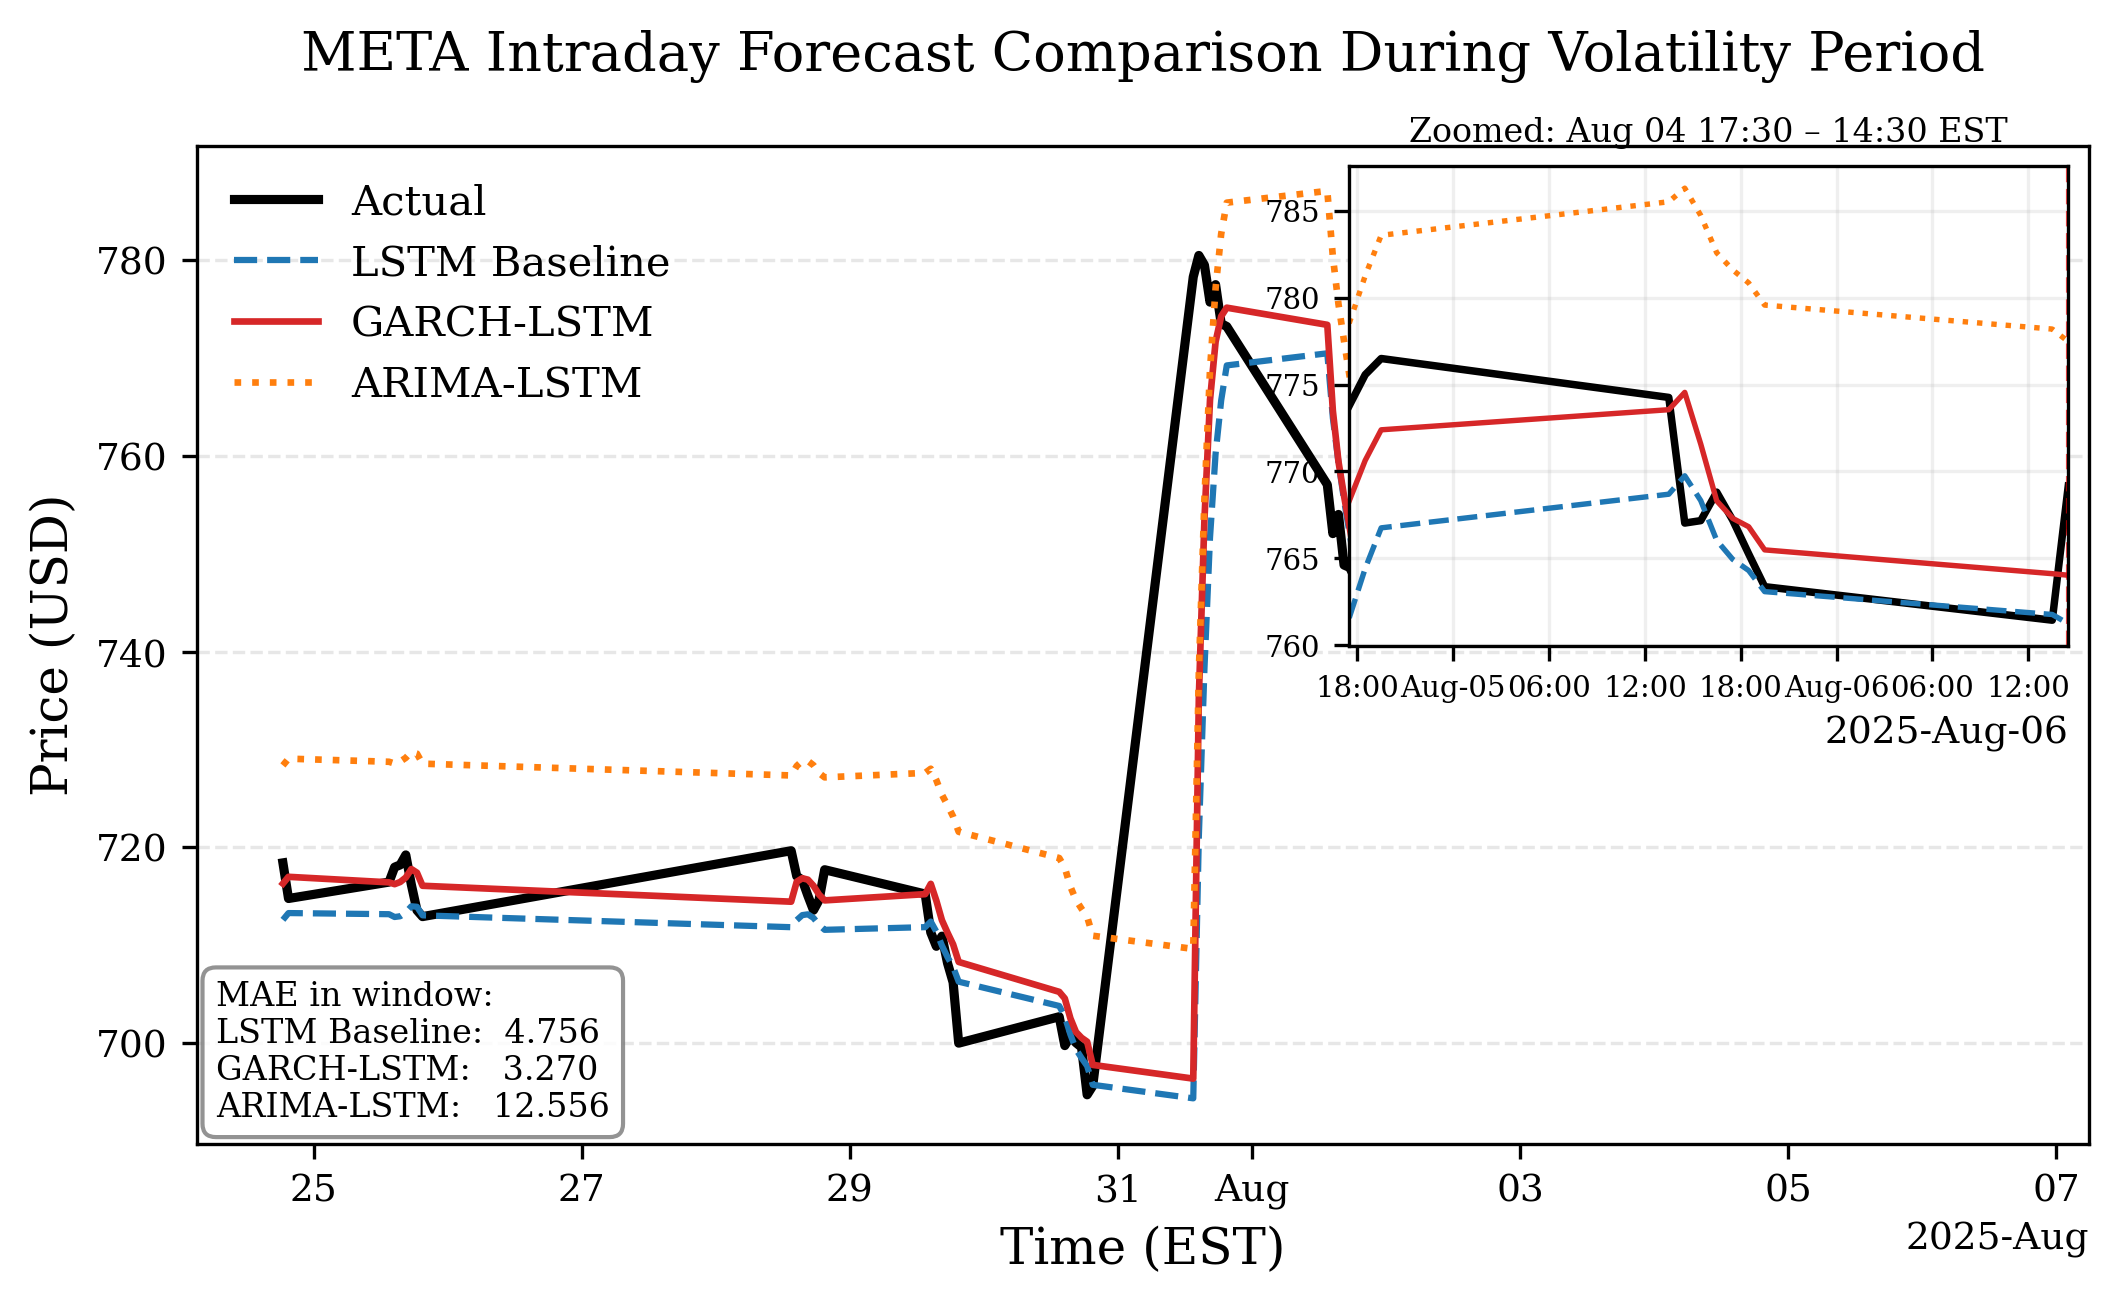
Main Results: The LSTM Baseline achieves the lowest overall average RMSE of 3.4955 and MAPE of 0.0080, outperforming all hybrid configurations in aggregate. Asset characteristics are the primary driver of forecasting accuracy, confirmed by a dominant stock effect across both architecture groups (Scheirer-Ray-Hare: H > 18, p < 0.005), while model selection does not produce statistically significant differences overall. LSTM-based models generally achieve lower average errors than ungated RNN architectures (RMSE 4.038 vs 4.233; MAPE 0.0092 vs 0.0107), though this difference is not statistically significant (Wilcoxon: W = 4890, p = 0.925). Statistically augmented models do not universally outperform baselines. Notably, GARCH–LSTM records the highest RMSE of 14.927 on META, suggesting that misalignment between statistical priors and event-driven volatility can amplify forecasting errors. However, during high-volatility periods, GARCH–LSTM achieved a lower MAE of 3.270 compared to the LSTM Baseline of 4.756, suggesting selective advantages for hybrid models under elevated market volatility.
Conclusions: The findings show that no single architecture consistently dominates across all assets, reflecting the heterogeneous nature of financial markets. The LSTM Baseline achieves the strongest overall performance, outperforming all hybrid configurations in aggregate. Statistical augmentation does not universally improve forecasting accuracy, and these results suggest that effective forecasting depends more on aligning model design with asset-specific characteristics than on increasing model complexity. However, hybrid models such as GARCH–LSTM showed selective advantages during high-volatility periods, suggesting that selective deployment during elevated market conditions may be more practical than general-purpose use. Several limitations should be noted. First, the evaluation is restricted to large-cap U.S. technology stocks at a single five-minute frequency, and it remains unclear whether the findings generalize to other asset classes or sampling intervals. Second, the embedded statistical coefficients are not explicitly constrained to satisfy classical parameter restrictions, as they are treated as learnable weights optimized through backpropagation rather than statistically inferred parameters. Future research should explore the application of this framework to broader asset classes such as bonds, commodities, and cryptocurrencies, as well as alternative sampling frequencies. Regime-aware model selection, where statistical priors are adaptively weighted based on real-time market conditions, represents a promising direction. Additionally, predicting returns rather than raw prices should be investigated to better align with the stationarity assumptions underlying classical ARIMA and GARCH formulations.
References
Andersen, T. G., Bollerslev, T., Diebold, F. X., & Labys, P. (2001). The distribution of realized exchange rate volatility. Journal of the American Statistical Association, 96(453), 42-55.
Box, G. E., Jenkins, G. M., Reinsel, G. C., & Ljung, G. M. (2015). Time series analysis: forecasting and control. New York: John Wiley & Sons.
Casolaro, A., Capone, V., Iannuzzo, G., & Camastra, F. (2023). Deep learning for time series forecasting: advances and open problems. Information, 14(11), 598.
Chatfield, C., & Xing, H. (2019). The analysis of time series: an introduction with R. New York: Chapman and Hall/CRC.
Chaudhuri, K., & Wu, Y. (2003). Random walk versus breaking trend in stock prices: evidence from emerging markets. Journal of Banking & Finance, 27(4), 575-592.
Di Persio, L., & Honchar, O. (2016). Artificial neural networks architectures for stock price prediction: comparisons and applications. International Journal of Circuits, Systems and Signal Processing, 10, 403-413.
Fischer, T., & Krauss, C. (2018). Deep learning with long short-term memory networks for financial market predictions. European Journal of Operational Research, 270(2), 654-669.
Hamilton, J. D. (2020). Time series analysis. New Jersey: Princeton University Press.
Hochreiter, S., & Schmidhuber, J. (1997). Long short-term memory. Neural Computation, 9(8), 1735-1780.
Jeribi, A., & Ghorbel, A. (2022). Forecasting developed and BRICS stock markets with cryptocurrencies and gold: generalized orthogonal generalized autoregressive conditional heteroskedasticity and generalized autoregressive score analysis. International Journal of Emerging Markets, 17(9), 2290-2320.
Jiang, W. (2021). Applications of deep learning in stock market prediction: recent progress. Expert Systems with Applications, 184, 115537.
Kingphai, K., & Moshfeghi, Y. (2022). On time series cross-validation for deep learning classification model of mental workload levels based on EEG signals. In Proceeding International Conference on Machine Learning, Optimization, and Data Science. (pp. 402-416). New York: Springer.
Liu, T. (2025). A transformer-based stock price prediction model utilising parallel multi-scale feature fusion. In Proceeding 5th International Conference on Computational Modeling, Simulation and Data Analysis. (pp. 533-539).
Nenkov, D. (2024). “The Magnificent Seven” technology stocks and their impact on the S&P 500: a review 4 years later. Finance, Accounting and Business Analysis, 6(2), 180-195.
Peters, E. E. (1996). Chaos and order in the capital markets: a new view of cycles, prices, and market volatility. New York: John Wiley & Sons.
Pooter, M. d., Martens, M., & Dijk, D. v. (2008). Predicting the daily covariance matrix for S&P 100 stocks using intraday data—but which frequency to use?. Econometric Reviews, 27(1-3), 199-229.
Scheirer, C. J., Ray, W. S., & Hare, N. (1976). The analysis of ranked data derived from completely randomized factorial designs. Biometrics, 32(2), 429–434.
Sezer, O. B., Gudelek, M. U., & Ozbayoglu, A. M. (2020). Financial time series forecasting with deep learning: a systematic literature review: 2005--2019. Applied Soft Computing, 90, 106181.
Thakkar, A., & Chaudhari, K. (2021). Fusion in stock market prediction: a decade survey on the necessity, recent developments, and potential future directions. Information Fusion, 65, 95-107.
Uddin, M. I., Mandyal, S., & Banger, M. (2025). A machine learning-based approach to stock market prediction: analysis and implementation. In Proceeding 2025 International Conference on Information, Implementation, and Innovation in Technology (I2ITCON). (pp. 1-6). IEEE.
Wilcoxon, F. (1945). Individual comparisons by ranking methods. Biometrics Bulletin, 1(6), 80–83.
Yu, Y. (2025). LSTM-based time series prediction model: a case study with yfinance stock data. In Proceeding ITM Web of Conferences. (pp. 03015). Les Ulis: EDP Sciences.
Downloads
Published
How to Cite
Issue
Section
License
Copyright (c) 2026 Faculty of Science, Burapha University

This work is licensed under a Creative Commons Attribution-NonCommercial-NoDerivatives 4.0 International License.
Burapha Science Journal is licensed under a Creative Commons Attribution-NonCommercial-NoDerivatives 4.0 International (CC BY-NC-ND 4.0) licence, unless otherwise stated. Please read our Policies page for more information