
A Comparison of Machine Learning Algorithms for Land Use and Land Cover Classification from Sentinel-2 Satellite Imagery in Chanthaburi Province
Keywords:
Machine Learning Algorithms, Land Use and Land Cover, Satellite Imagery, Sentinel-2, Google Earth EngineAbstract
Background and Objectives: Chanthaburi province is characterized by highly diverse land use and land cover (LULC), encompassing agricultural lands, orchards, forests, urban areas, and coastal zones. These areas undergo continuous modifications due to agricultural expansion, urbanization, and environmental transformations. Consequently, possessing accurate, up-to-date, and high-resolution LULC data is crucial for effective natural resource planning and management. Currently, geoinformatics technology, particularly Sentinel-2 satellite imagery combined with machine learning techniques, has gained significant popularity for LULC classification due to its efficiency in managing large and complex datasets. However, each algorithm has distinct advantages and limitations; therefore, evaluating their performance is necessary to determine the most optimal approach. This study aimed to compare the performance of four machine learning algorithms: Random Forest (RF), Support Vector Machine (SVM), Decision Tree (DT), and Maximum Entropy (MaxEnt), for classifying seven LULC categories in Chanthaburi province. The primary focus was to evaluate the accuracy and suitability of each method when applied to satellite imagery.
Methodology: This study utilized atmospherically corrected Level-2A Sentinel-2 satellite imagery acquired on January 12, 2026. The selected imagery had less than 5% cloud cover to ensure high data quality and minimize weather-related impacts. All data were processed on the Google Earth Engine (GEE) platform. The spectral bands incorporated into the analysis included Band 2 (Blue), Band 3 (Green), Band 4 (Red), Band 8 (Near Infrared: NIR), and Band 11 (Shortwave Infrared: SWIR). Furthermore, four spectral indices—Normalized Difference Vegetation Index (NDVI), Normalized Difference Built-up Index (NDBI), Modified Normalized Difference Water Index (MNDWI), and Bare Soil Index (BSI)—were integrated to enhance the discrimination capability for LULC types sharing similar spectral signatures. Stratified random sampling was conducted, utilizing 1,000 training samples and 400 testing samples across the seven LULC categories. All algorithms underwent hyperparameter tuning via Grid Search and 5-fold Cross-Validation on the GEE platform to optimize their performance prior to classification. The final results were evaluated using various statistical metrics, including Overall Accuracy (OA), Kappa Coefficient, class-specific F1-scores, and a Z-test at a 95% confidence level to assess statistically significant differences in performance among the models.
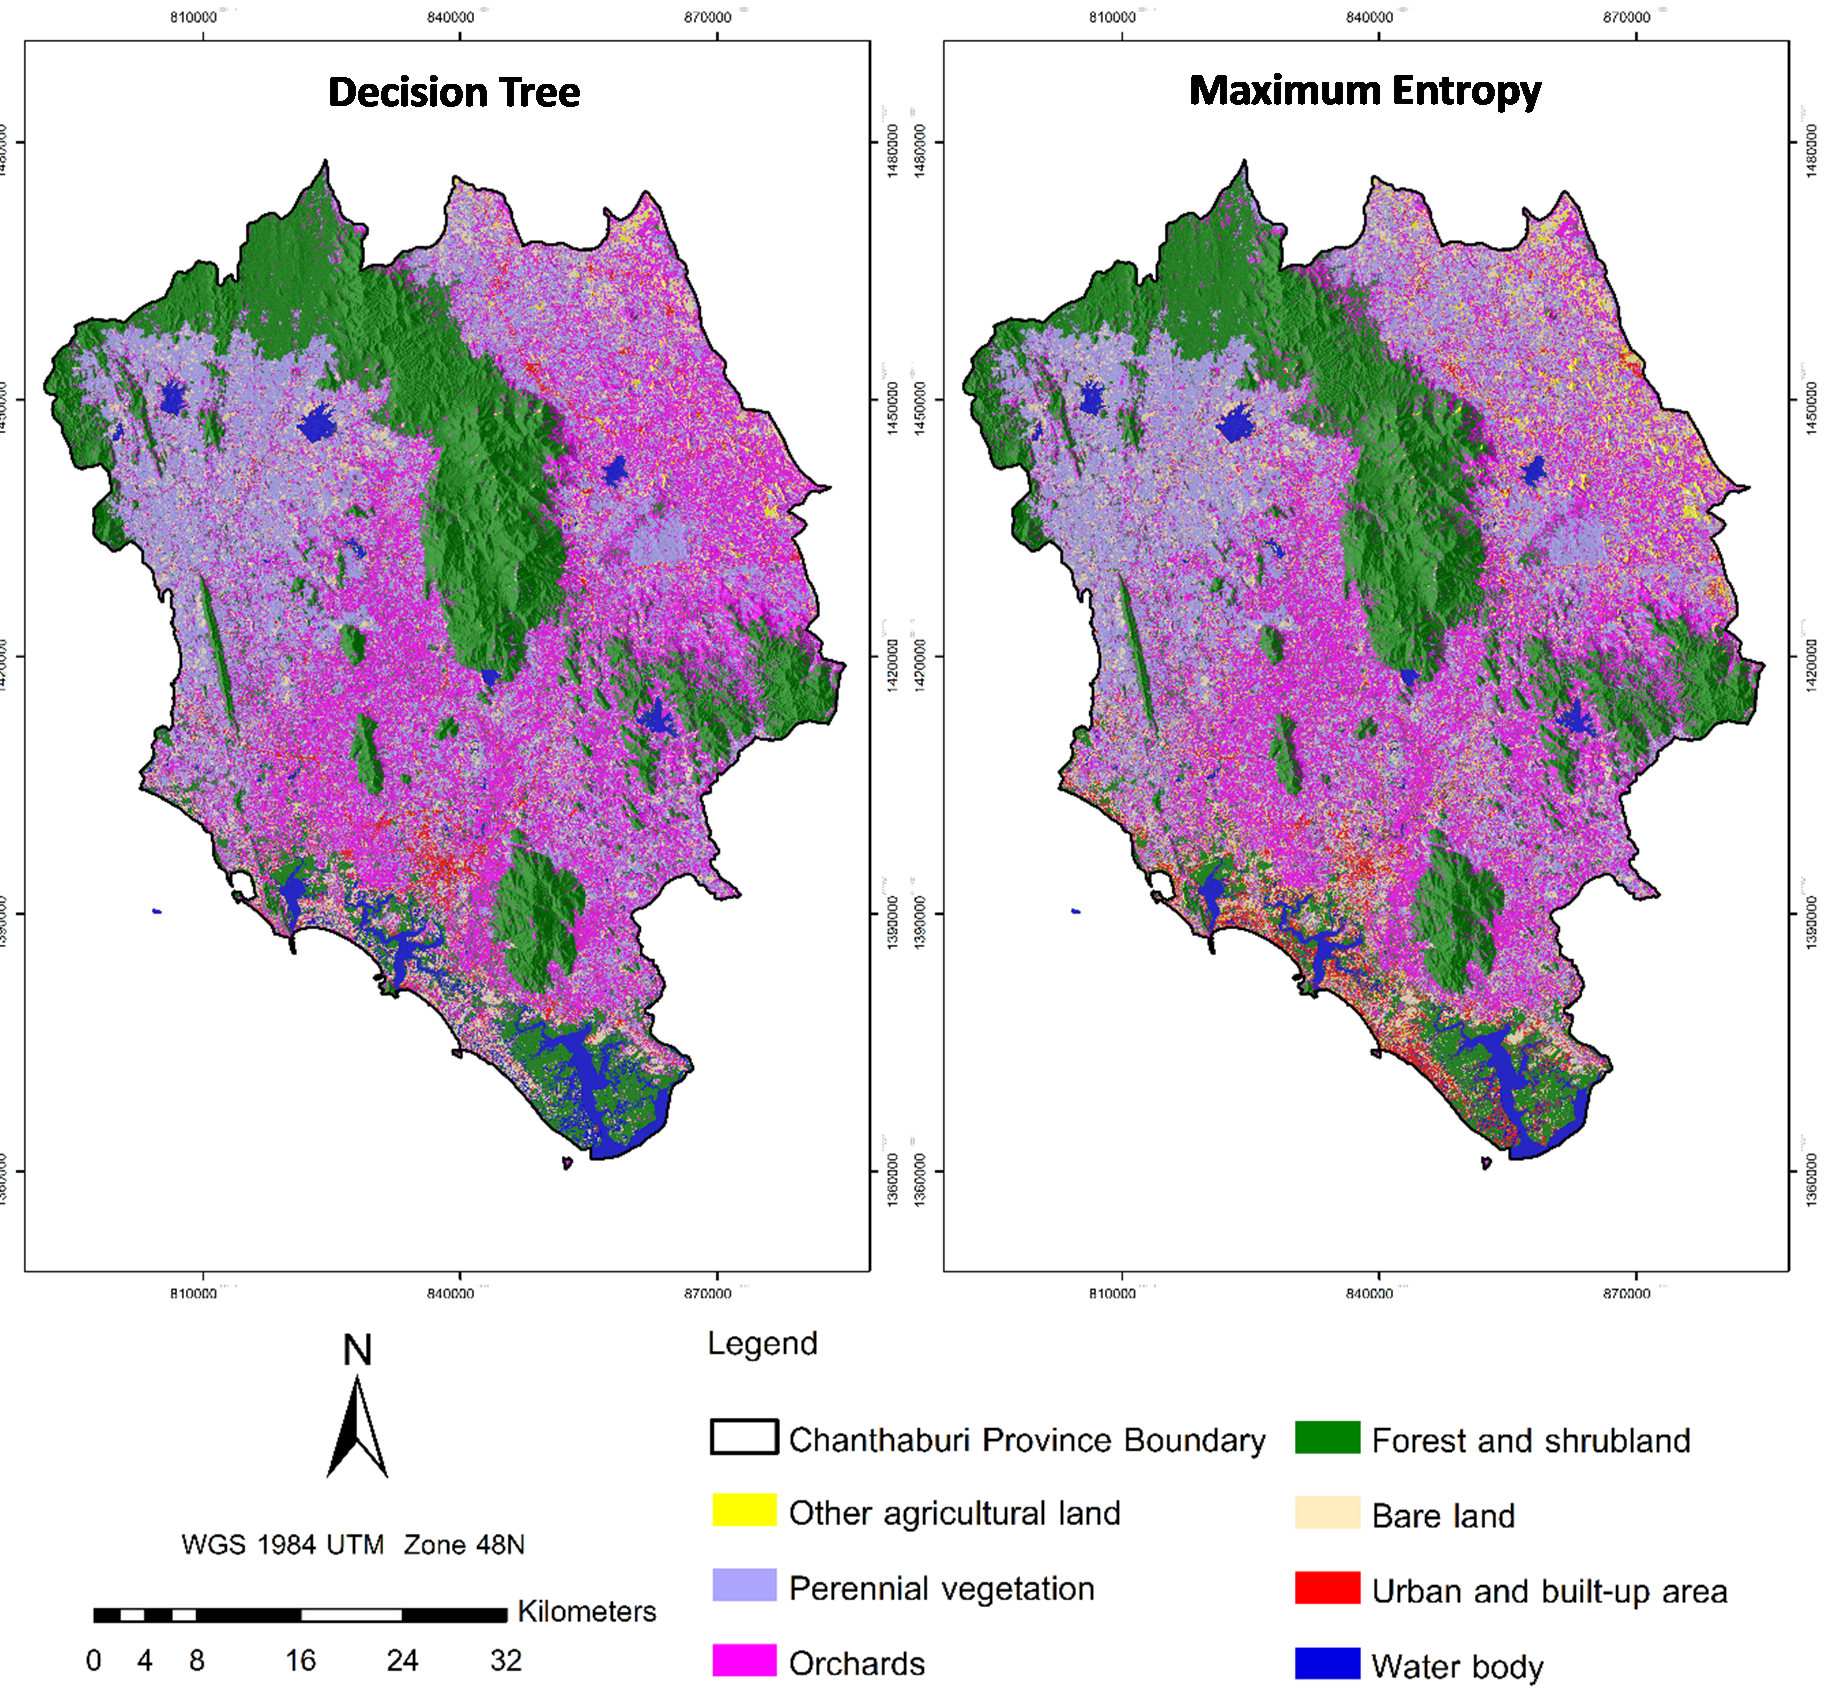
Main Results: The LULC classification revealed that the Random Forest (RF) algorithm yielded the most superior results, achieving a high Overall Accuracy (OA) of 90.25% and a Kappa coefficient of 0.88, which indicated a robust agreement between the classified outputs and the ground truth data. This was followed by the Decision Tree (DT) method, which achieved an OA of 86.25% and a Kappa coefficient of 0.83, and the Support Vector Machine (SVM) with an OA of 84.25% and a Kappa coefficient of 0.81. Conversely, the Maximum Entropy (MaxEnt) method produced the lowest performance, yielding an OA of 69.50% and a Kappa coefficient of 0.63. At the individual class level, the water body class exhibited the highest accuracy, reaching an F1-score of 0.99 under the RF method, owing to its distinct spectral characteristics. In contrast, the orchard class demonstrated the lowest accuracy across all algorithms, as its spectral signature closely resembled that of forest or perennial tree areas, resulting in classification confusion. The statistical Z-test confirmed that the performance of the RF algorithm was significantly different from the other algorithms at the 95% confidence level, demonstrating the efficacy of this method in handling complex and non-linear data.
Conclusions: The Random Forest (RF) algorithm is the most effective method for classifying the seven LULC types in Chanthaburi province using Sentinel-2 satellite imagery when compared to the other evaluated algorithms, particularly in scenarios involving highly complex and variable data. Additionally, the application of the Google Earth Engine platform significantly enhances the processing efficiency of large-scale spatial data, mitigates computational resource constraints, and facilitates rapid analysis. The knowledge derived from this research can be effectively applied to land use planning, natural resource management, LULC change monitoring, and supporting policy-level decision-making at both provincial and regional scales.
References
Abdi, A.M. (2020). Land cover and land use classification performance of machine learning algorithms in a boreal landscape using Sentinel-2 data. GISscience & Remote Sensing, 57(1), 1-20. https://doi.org/10.1080/15481603.2019.1650447
Aggarwal, N., Srivastava, M., & Dutta, M. (2016). Comparative analysis of pixel-based and object-based classification of high resolution remote sensing images – A review. International Journal of Engineering Trends and Technology, 38(1), 5–11.https://doi.org/10.14445/22315381/IJETT-V38P202
Arora, M.K., & Watanachaturaporn, P. (2004). Support Vector Machines for Classification of Multi- and Hyperspectral Data. In: Advanced Image Processing Techniques for Remotely Sensed Hyperspectral Data. Springer, Berlin, Heidelberg. https://doi.org/10.1007/978-3-662-05605-9_11
Belgiu, M., & Drăguţ, L. (2016). Random forest in remote sensing: A review of applications and future directions. ISPRS Journal of Photogrammetry and Remote Sensing, 114, 24–31. https://doi.org/10.1016/j.isprsjprs.2016.01.011
Breiman, L. (2001). Random forests. Machine Learning, 45(1), 5–32. https://doi.org/10.1023/A:1010933404324
Breiman, L., Friedman, J., Stone, C. J., & Olshen, R. A. (1984). Classification and regression trees. CRC Press.
Department of Provincial Administration (DOPA). (2023). Population statistics and administrative area data. Bangkok, Thailand: Ministry of Interior.
Intarat, K., & Sillaparat, S. (2019). Tropical mangrove species classification using random forest algorithm and very high-resolution satellite imagery. Burapha Science Journal, 24(2), 742–753. (in Thai)
Intarat, K. (2022). Land use classification in Nakhon Nayok Province using machine learning algorithms and Sentinel-2 imagery. Burapha Science Journal, 27(2), 1153–1171. (in Thai)
Macintyre, P., van Niekerk, A., & Mucina, L. (2020). Efficacy of multi-season Sentinel-2 imagery for compositional vegetation classification. International Journal of Applied Earth Observation and Geoinformation, 85, 101980. https://doi.org/10.1016/j.jag.2019.101980
Mazzia, V., Khaliq, A., & Chiaberge, M. (2020). Improvement in land cover and crop classification based on temporal features learning from Sentinel-2 data using recurrent-convolutional neural network. Applied Sciences, 10(1), 238. https://doi.org/10.3390/app10010238
National Statistical Office (NSO). (2023). Statistical data of Thailand: Population and housing statistics. Bangkok,Thailand: Ministry of Digital Economy and Society.
Piedelobo, L., Hernandez-Lopez, D., Ballesteros, R., Chakhar, A., Del Pozo, S., Gonzalez-Aguilera, D., & Moreno, M. A. (2019). Scalable pixel-based crop classification combining Sentinel-2 and Landsat-8 data time series. Agricultural Systems, 171, 36–50. https://doi.org/10.1016/j.agsy.2019.01.005
Richards, J.A. , & Jia, X. (2006) Remote Sensing Digital Image Analysis: An Introduction. Springer, Berlin, 207.
Rodriguez-Galiano, V. F., Ghimire, B., Rogan, J., Chica-Olmo, M., & Rigol-Sanchez, J. P. (2012). An assessment of the effectiveness of a random forest classifier for land-cover classification. ISPRS Journal of Photogrammetry and Remote Sensing, 67, 93–104. https://doi.org/10.1016/j.isprsjprs.2011.11.002
Richards, J. A. (2013). Remote sensing digital image analysis: An introduction (5th ed.). Springer. https://doi.org/10.1007/978-3-642-30062-2
Rikimaru, A., Roy, P. S., & Miyatake, S. (2002). Tropical forest cover density mapping. Tropical Ecology, 43(1), 39–47.
Tucker, C. J. (1979). Red and photographic infrared linear combinations for monitoring vegetation. Remote Sensing of Environment, 8(2), 127–150. https://doi.org/10.1016/0034-4257(79)90013-0
Viera, A. J., & Garrett, J. M. (2005). Understanding interobserver agreement: The kappa statistic. Family Medicine, 37(5), 360–363.
Xu, H. (2006). Modification of normalised difference water index (NDWI) to enhance open water features in remotely sensed imagery. International Journal of Remote Sensing, 27(14), 3025–3033. https://doi.org/10.1080/01431160600589179
Zha, Y., Gao, J., & Ni, S. (2003). Use of normalized difference built-up index in automatically mapping urban areas from TM imagery. International Journal of Remote Sensing, 24(3), 583–594. https://doi.org/10.1080/01431160304987
Downloads
Published
How to Cite
Issue
Section
License
Copyright (c) 2026 Faculty of Science, Burapha University

This work is licensed under a Creative Commons Attribution-NonCommercial-NoDerivatives 4.0 International License.
Burapha Science Journal is licensed under a Creative Commons Attribution-NonCommercial-NoDerivatives 4.0 International (CC BY-NC-ND 4.0) licence, unless otherwise stated. Please read our Policies page for more information