Estimation of the Population Mean of the XLindley Distribution with Applications to Water Quality Data
Keywords:
maximum likelihood method, bootstrap method, mixture distribution, variance derivation, water pollutionAbstract
Background and Objectives: The XLindley distribution is a continuous probability distribution with a single positive parameter, developed from the exponential and Lindley distributions. It is suitable for modelling time-to-event data, chemical decay processes, and product lifetimes. However, no previous study has investigated the estimation of the population mean for this distribution. Therefore, this study aims to investigate parameter estimation methods for the population mean of the XLindley distribution, evaluate the performance of the estimators, and apply the proposed methods to real data.
Methodology: The point estimators for the parameter of the XLindley distribution considered in this study include the method of moments, which is based on the relationship between population and sample moments; the maximum likelihood method, which determines the parameter value that maximizes the likelihood function; and the bootstrap method, which uses resampling with replacement to approximate the sampling distribution of the estimator. For interval estimation of the population mean, the large-sample approximation method, the Wald-type method based on the asymptotic normal distribution and Fisher information, and the percentile bootstrap method are employed to construct confidence intervals. The performance of these methods is evaluated in terms of bias and mean squared error for point estimation, as well as coverage probability and average confidence interval length for interval estimation. A simulation study is conducted under various scenarios with sample sizes of 10, 20, 30, 50, 100, and 200, and population mean values of 0.02, 0.1, 0.21, 1.25, 2.89, and 18.26 to reflect different distributional characteristics and a wide range of possible situations. Afterward, the proposed methods are applied to estimate the population mean using two real datasets following the XLindley distribution.
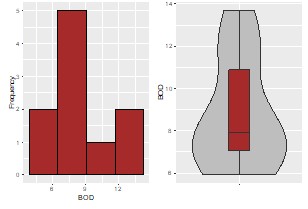
Main Results: The point estimator obtained from the maximum likelihood method performs comparably to that obtained from the method of moments in terms of bias and mean squared error, whereas the bootstrap estimator exhibits higher bias than the other estimators considered in this study. For interval estimation, the Wald method provides coverage probabilities close to the nominal confidence level of 0.95 and yields relatively short average interval lengths when the mean of the XLindley distribution exceeds 0.10. If the mean is less than or equal to 0.10, the large-sample approximation method based on the normal distribution provides coverage probabilities closer to 0.95 than the alternative methods. In contrast, the percentile bootstrap method produces coverage probabilities lower than the nominal level in several scenarios. When the proposed methods are applied to water quality data in Thailand, the estimated mean of biological oxygen demand from water sources in 10 districts with the highest numbers of industrial factories in Bangkok in 2024 was 8.823 mg/L, with a 95% confidence interval of (5.783, 16.924). Meanwhile, the estimated mean arsenic concentration from eight monitoring stations along the Kok River in Chiang Rai in 2025 was 0.017 mg/L, with a 95% confidence interval of (0.005, 0.029).
Conclusions: Although the maximum likelihood estimator and the method of moments estimator exhibit comparable performance in the simulation study, the maximum likelihood estimator possesses the invariance property, which is widely useful in statistical inference theory. Therefore, this estimator is recommended for point estimation of the population mean of the XLindley distribution. For interval estimation, the choice of method should depend on the mean of the XLindley-distributed data in order to obtain the confidence interval with efficient coverage performance. In application, these estimation methods can be applied to real-world data analysis. The findings from the real datasets considered in this study indicate that the average biological oxygen demand in Bangkok was below 20 mg/L, implying that the water sources in this area are within the safety standard established by the World Health Organization. In contrast, the average arsenic concentration in the Kok River in Chiang Rai during the study period exceeded 0.01 mg/L, which does not meet the recommended standard and may adversely affect living organisms and aquatic ecosystems.
References
Akhter, Z., MirMostafaee, S. M. T. K., Bakar, A., & Ormoz, E. (2026). On the order statistics from the XLindley distribution and associated inference with an application to fatigue data. Filomat, 40(9), 3311-3339.
Alomair, A. M., Ahmed, M., Tariq, S., Ahsan-ul-Haq, M., & Talib, J. (2024). An exponentiated XLindley distribution with properties, inference and applications. Heliyon, 10(3), e25472.
Casella, G., & Berger, R. (2024). Statistical Inference. Boca Raton: Chapman and Hall/CRC.
Chouia, S., & Zeghdoudi, H. (2021). The XLindley distribution: Properties and application. Journal of Statistical Theory and Applications, 20(2), 318-327.
Davison, A. C., & Hinkley, D. V. (1997). Bootstrap Methods and Their Application. Cambridge: Cambridge University Press.
Efron, B. (1992). Bootstrap methods: Another look at the jackknife. In Breakthroughs in Statistics: Methodology and distribution (pp. 569-593). Springer.
Ghitany, M. E., Atieh, B., & Nadarajah, S. (2008). Lindley distribution and its application. Mathematics and Computers in Simulation, 78(4), 493-506.
Hafez, E. H., Riad, F. H., Mubarak, S. A., & Mohamed, M. S. (2020). Study on Lindley distribution accelerated life tests: Application and numerical simulation. Symmetry, 12(12), 2080.
Mazucheli, J., & Achcar, J. A. (2011). The Lindley distribution applied to competing risks lifetime data. Computer Methods and Programs in Biomedicine, 104(2), 188-192.
McLachlan, G., & Peel, D. (2000). Finite Mixture Models. Hoboken: John Wiley & Sons.
Musekwa, R. R., & Makubate, B. (2024). A flexible generalized XLindley distribution with application to engineering. Scientific African, 24, e02192.
R Core Team. (2023). R: A Language and Environment for Statistical Computing. R Foundation for Statistical Computing, Vienna, Austria.
Rousselet, G. A., Pernet, C. R., & Wilcox, R. R. (2021). The percentile bootstrap: A primer with step-by-step instructions in R. Advances in Methods and Practices in Psychological Science, 4(1), 1-10.
Sangnawakij, P. (2025). On estimation of the population mean in a two-parameter Rayleigh distributed variable with applications to environmental studies. ScienceAsia, 51(1), 123-135.
Sugakova, O., & Maiboroda, R. (2021). Principal components analysis for mixtures with varying concentrations, Modern Stochastics: Theory and Applications, 8(4), 509-523.
Tashkandy, Y. A., Bakr, M. E., Benchiha, S. A., Sapkota, L. P., Balogun, O. S., Mekiso, G. T., Hussam, E., & Gemeay A. M. (2024). Power modified XLindley distribution: Statistical properties and applications. Scientific Reports, 14, 20262.
Teawpongpan, T., & Sangnawaki, P. (2023). Confidence interval for the population mean of Rayleigh distribution with application to shear wave velocity of soils in Thailand, Journal of Applied Science and Emerging Technology, 22(3), 1-9.
Thongjub, N., & Panichkitkosolkul, P. (2026). Improved inference for the XLindley distribution: A comparative analysis of confidence intervals and applications, Statistics, Optimization & Information Computing, 15(6), 4900-4921.
World Health Organization. (2003). Arsenic in drinking-water: Background document for development of WHO guidelines for drinking-water quality. https://www.who.int/publications/i/item/arsenic-in-drinking-water-background-document-for-development-of-who-guidelines-for-drinking-water-quality
Downloads
Published
How to Cite
Issue
Section
License
Copyright (c) 2026 Faculty of Science, Burapha University

This work is licensed under a Creative Commons Attribution-NonCommercial-NoDerivatives 4.0 International License.
Burapha Science Journal is licensed under a Creative Commons Attribution-NonCommercial-NoDerivatives 4.0 International (CC BY-NC-ND 4.0) licence, unless otherwise stated. Please read our Policies page for more information