
Analysis of Spatial and Temporal Patterns of Meteorological Drought Exposure and Its Impact on Economic Crops, Nakhon Ratchasima Province, Thailand
Keywords:
Meteorological drought exposure, Spatial and temporal patterns of meteorological drought, Impact of drought on cropsAbstract
Background and Objectives: Drought is one of the most complex influencing factors among all-natural disasters. It is a complex phenomenon because of the unpredictable start and end of its period, the length of the event, as well as the nonspecific spatial extent or geography and uncertain frequency and intensity. Meanwhile, meteorological drought is usually defined based on the degree of dryness and the duration of the dry period. Nakhon Ratchasima province is a drought-prone area since the annual rainfall between 1975 and 2022 was mostly lower than the average annual rainfall in the same period, with a value of 1,223.59 mm for about 24 years. Therefore, this study aims to examine spatial and temporal patterns of meteorological drought exposure and its impact on economic crops in Nakhon Ratchasima province. The objectives of the study were (1) to classify and map meteorological drought frequency, intensity and exposure and (2) to analyze spatial and temporal patterns of meteorological drought exposure and its impact on economic crops. Herein
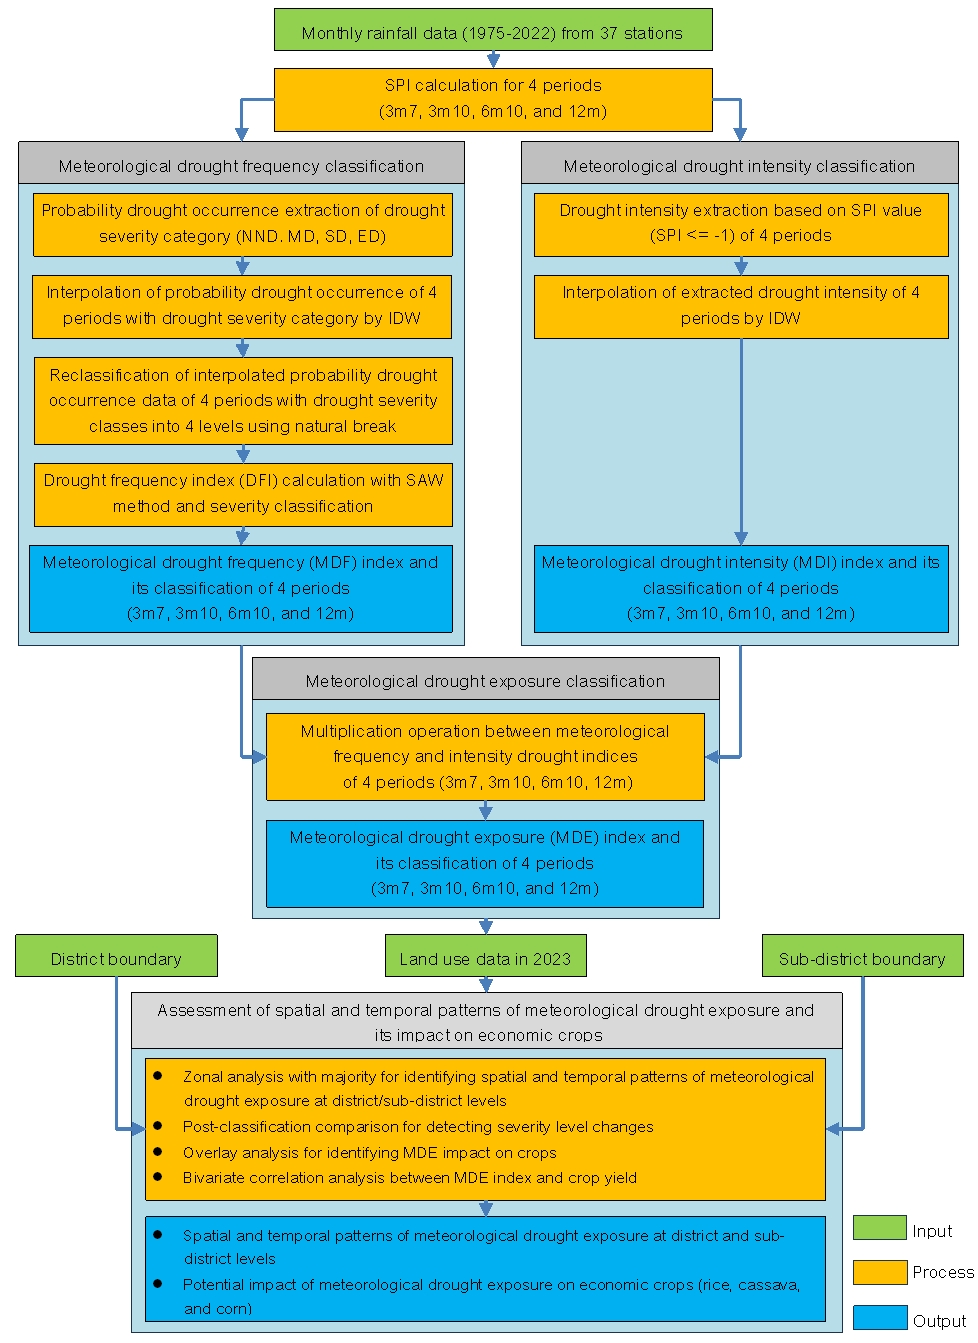
Methodology: The research methodology comprised four main steps after the Standardized Precipitation Index calculation in 4 periods, including 3m7 (May to July), 3m10 (August to October), 6m10 (May to October), and 12m (January to December): (1) meteorological drought frequency index extraction and classification, (2) meteorological drought intensity index extraction and classification, (3) meteorological drought exposure index extraction and classification, and (4) spatial and temporal patterns analysis of meteorological drought exposure and its impact on economic crops: rice, cassava, sugarcane and corn. Herein, three meteorological drought indices, meteorological drought frequency, meteorological drought intensity, and meteorological drought exposure, were calculated based on a long-term rainfall record (1975-2022) from 37 stations. In the meantime, spatial and temporal patterns of meteorological drought exposure at district and sub-district levels using zonal analysis with majority operation.
Main Results: The most dominant class of meteorological drought exposure classification of the 4 periods (3m7, 3m10, 6m10 and 12m) was a moderate, moderate, moderate, and low covered area of about 33.22%, 35.26%, 42.11% and 35.69%, respectively. The spatial distribution of the meteorological drought exposure classification of the 4 periods displayed a completely different pattern. Still, the meteorological drought exposure severity classification of the 4 periods showed a strong positive linear relationship among them. The correlation coefficient values varied from 0.8100 to 0.8966. These results imply the similarity of meteorological drought exposure patterns among 4 periods. Besides, the majority severity classification of the meteorological drought exposure in the 6m10 period exhibited the highest impacts at district and sub-district levels, with 16 districts and 138 sub-districts. Based on the spatial pattern changes of meteorological drought exposure severity levels among 3-periods (3m7, 3m10 and 6m10), covering the economic crop calendar, the severity classification of the meteorological drought exposure in the 6m10 period exposed the highest meteorological drought compared with other periods (3m7 and 3m10). In the meantime, the potential impact areas of meteorological drought exposure in the 6m10 period (May to October) at moderate, high, and very high severity levels on rice in 2023 was about 3,939.40 sq. km 64.65% of the total area of rice, cassava about 2,918.67 sq. km 75.74% of the total area of cassava, sugarcane, about 1,423.47 sq. km or 69.48% of the total area of sugarcane, and corn, about 441.33 sq. km or 56.38% of the total area of corn. Furthermore, based on Pearson bivariate correlation analysis, the most dominant meteorological drought exposure index that impacts crop yield is the meteorological drought exposure index in the 3m7 period (May to July). This index displayed a negative linear relationship with the average rice, cassava and corn yield between 2011 and 2022. On the contrary, the meteorological drought exposure index showed no linear relationship with sugarcane since a multi-cropping system of about three years is applied for sugarcane by farmers.
Conclusions: Spatial and temporal patterns analysis of meteorological drought exposure were successfully conducted based on a standardized precipitation index for quantifying the severity of drought and its impact on economic crops in different periods (3m7, 3m10, 6m10 and 12m). The presented research workflow can be used as a guideline for the relevant government agencies, such as the Department of Agricultural Extension and the Department of Disaster Prevention and Mitigation, to monitor meteorological drought for mitigation of the potential impact of drought on economic crops in the future. In addition, early warning systems of meteorological drought at the regional level are recommended to be implemented by the Thai Meteorological Department.
References
Caloiero, T., & Veltri, S. (2019). Drought Assessment in the Sardinia Region (Italy) During 1922–2011 Using the Standardized Precipitation Index. Pure and Applied Geophysics, 176, 925-935.
Climate Data. (2023). Nakhon Ratchasima Climate, Thailand.
https://en.climate-data.org/asia/thailand/nakhon-ratchasima-province/nakhon-ratchasima-5993/
Cohen, J. (1988). Statistical power analysis for the behavioral sciences. 2nd edition. Hillsdale, NJ: Lawrence Erlbaum.
Gordon, A.H. (1992). The random nature of drought: mathematical and physical causes. International Journal of Climatology, 13(5), 497-507.
He, Q., Wang, M., Liu, K., Li, B., & Jiang, Z. (2023). Spatiotemporal analysis of meteorological drought across China based on the high-spatial-resolution multiscale SPI generated by machine learning. Weather and Climate Extremes, 40, 100567.
Jensen, J.R. (2015) Introductory digital image processing: a remote sensing perspective. (4th ed.). Columbia: University of South Carolina.
Kaliszewski, I., & Podkopaev, D. (2016). Simple additive weighting - A metamodel for multiple criteria decision analysis methods. Expert Systems with Applications, 54, 155-161.
Karimi, M., Shahedi, K., Raziei, T., & Miryaghoubzadeh, M. (2022). Meteorological and agricultural drought monitoring in Southwest of Iran using a remote sensing-based combined drought index. Stochastic Environmental Research and Risk Assessment, 36, 3707-3724.
Kornkosa, S., Phumkokrux, N., Pattanasak, P., & Manajitprasert, S. (2021). Analysis and prediction of Meteorological Drought Area by using Standardized Precipitation Index in Northeast, Thailand. International Journal of Environmental Science and Development, 12(12), 372-376.
Lawal, S., Hewitson, B., Egbebiyi, T.S., & Adesuyi, A. (2021). On the suitability of using vegetation indices to monitor the response of Africa’s terrestrial ecoregions to drought. Science of The Total Environment. 792, 148282.
LDD (Land Development Department). (2009). Land use plans, Lamtakhong watershed. Bangkok: Ministry of Agriculture and Cooperatives.
Malczewski, J. (2000). On the Use of Weighted Linear Combination Method in GIS: Common and Best Practices Approaches. Transactions in GIS, 4(1), 5-22.
McKee, T.B., Doesken, N.J., & Kleist, J. (1993). The Relationship of Drought Frequency and Duration to Time Scales. Proceedings of the 8th Conference on Applied Climatology (pp. 179-148). California: American Meteorological Society.
Mehr, A.D., Sorman, A.U., Kahya, E., & Afshar, M.H. (2020). Climate change impacts on meteorological drought using SPI and SPEI: a case study of Ankara, Turkey. Hydrological Sciences Journal, 65(2), 254-268.
Mohammed, S., Alsafadi, K., Enaruvbe, G.O., Bashir, B., Elbeltagi, A., Széles, A., Alsalman, A., & Harsanyi, E. (2022). Assessing the impacts of agricultural drought (SPI/SPEI) on maize and wheat yields across Hungary. Scientific Reports, 12, 8838.
National Drought Mitigation Center, University of Nebraska. (2024). Type of drought. https://drought.unl.edu/Education/DroughtIn-depth/TypesofDrought.aspx
Nimisha, K., & Arunkumar, R. (2023). Meteorological drought analysis under climate change scenario using SPI index. Proceedings of The International Conference on Emerging Trends in Engineering, Yukthi-2023 (pp. 394-400). Kozhikode: Department of Civil Engineering, Government Engineering College.
Nosrati, K., & Zareiee, A.R. (2011). Assessment of meteorological drought using SPI in West Azerbaijan Province, Iran. Journal of Applied Sciences and Environmental Management, 15(4), 563-569.
Office of Agricultural Economics. (2010). Geospatial Data of Agricultural Land Use Based on Color Orthophotography 1:4000, Nakhon Ratchasima Province. Bangkok: Office of Agricultural Economics.
Omar, A.A., Chiang, J-L., & Daud, B.H. (2023). Spatiotemporal Analysis of Meteorological Drought Using Standardized Precipitation Index (SPI) in Gabiley Region, Somaliland. Journal of Geoscience and Environment Protection, 11, 47-59.
Pande, C.B., Al-Ansari, N., Kushwaha, N.L., Srivastara, A., Noor, R., Kumar, M., Moharir, K.N., & Elbeltagi, A. (2022). Forecasting of SPI and Meteorological Drought Based on the Artificial Neural Network and M5P Model Tree. Land, 11(11), 2040.
Pandhumas, T., Kuntiyawichai, K., Jothityangkoon, C., & Suryadi, F.X. (2020). Assessment of climate change impacts on drought severity using SPI and SDI over the Lower Nam Phong River Basin, Thailand. Engineering and Applied Science Research, 47(3), 326-338.
Park, S., Im, J., Jang, E., & Rhee, J. (2016). Drought assessment and monitoring through blending of multi-sensor indices using machine learning approaches for different climate regions. Agricultural and Forest Meteorological, 216,157-169.
Patel, N.R., Chopra, P., & Dadhwal, V.K. (2007). Analysis spatial patterns of meteorological drought using standardized precipitation index. Meteorological Applications, 14(4), 329-336.
Prasertsri, P. (2020). The Impact of Drought on Agriculture in 2020. Bangkok: USDA.
Promping, T., & Tingsanchali, T. (2021). Meteorological drought hazard assessment for agricultural area in eastern region of Thailand. Proceedings of The 26th National Convention on Civil Engineering. Bangkok: Department of Civil Engineering, KMITL.
Sehgal, V.K., & Dhakar, R. (2016). Geospatial approach for assessment of biophysical vulnerability to agricultural drought and its intra-seasonal variations. Environmental Monitoring and Assessment, 188, 197.
Son, N.T., Chen, C.F., Chen, C.R., Chang, L.Y., & Minh, V.Q. (2012). Monitoring agricultural drought in the Lower Mekong Basin using MODIS NDVI and land surface temperature data. International Journal of Applied Earth Observation and Geoinformation, 18, 417-427.
Sönmez, F.K., Komuscu, A.U., Erkan, A., & Turgu, E. (2005). An analysis of spatial and temporal dimension of drought vulnerability in Turkey using the standardized precipitation index. Natural Hazards, 35,243-264.
Svoboda, M., Fuchs, B., & Integrated Drought Management Programme (IDMP). (2016). Handbook of Drought Indicators and Indices. Drought Mitigation Center Faculty Publications.
Tadesse, T., Wardlow, B.D., Hayes, M.J., Svoboda, M., & Brown, J.F. (2010). The Vegetation Outlook (VegOut): A New Method for predicting vegetation seasonal greenness. GIScience & Remote Sensing, 47(1), 25-52.
U.S. Drought Monitor. (2025). U.S. Drought Monitor. https://droughtmonitor.unl.edu/
Wambua, R.M., Mutua, B.M., & Raude, J.M. (2018). Detection of Spatial, Temporal and Trend of Meteorological Drought Using Standardized Precipitation Index (SPI) and Effective Drought Index (EDI) in the Upper Tana River Basin, Kenya. Open Journal of Modern Hydrology, 8(3), 83-100.
Wattanakij, N., Tavorntam, W., & Mongkolsawat, C. (2006). Analyzing spatial pattern of drought in the northeast of Thailand using multi-temporal standardized precipitation index (SPI). Proceedings of the 27th Asian Association on Remote Sensing Asian Conference Remote Sensing. (pp. 1221–1226) Ulaanbaatar, Mongolia: Association on Remote Sensing Asian Conference Remote Sensing.
Wichitarapongsakun, P., Sarin, C, Klomjek, P., & Chuenchooklin, S. (2016). Meteorological drought in the Saea Krang River basin using the Standardized Precipitation Index (SPI) and Meteorological Drought Index (D). Naresuan University Journal: Science and Technology, 24(3), 123-135. (in Thai)
Wilhite, D.A. (2000). Drought as a Natural Hazard: Concepts and Definitions. Drought Mitigation Center Faculty Publications.
Wilhite, D.A., & Glantz, M.H. (1985). Understanding the Drought Phenomenon: The Role of Definitions. Water International, 10(3), 111-120.
Wilhite, D.A., Svoboda, M.D., & Hayes, M.J. (2006). Understanding the complex impacts of drought: a key to enhancing drought mitigation and preparedness. Water Resources Management, 21, 763-774.
WMO (World Meteorological Organization). (2012). Standardized Precipitation Index User Guide. Switzerland: World Meteorological Organization.
Yilmaz, B. (2018). A Novel Approach for Drought Characterization Based on Performance-Oriented SPI: An Illustrative Case of Southeastern Anatolia Region, Turkey. Applied Ecology and Environmental Research, 16(5), 7289-7303.
Zhou, H. , & Liu, Y. (2016). SPI Based Meteorological Drought Assessment over a Humid Basin: Effects of Processing Schemes. Water, 8(9), 373.
Downloads
Published
How to Cite
Issue
Section
License
Copyright (c) 2025 Faculty of Science, Burapha University

This work is licensed under a Creative Commons Attribution-NonCommercial-NoDerivatives 4.0 International License.
Burapha Science Journal is licensed under a Creative Commons Attribution-NonCommercial-NoDerivatives 4.0 International (CC BY-NC-ND 4.0) licence, unless otherwise stated. Please read our Policies page for more information