A Comparison of Efficiency for Homogeneity of Variance Tests under Mixture Normal Distribution
Keywords:
Homogeneity of variance tests, Mixture normal distribution, Type I error, Power of the testAbstract
Background and Objectives: In statistical data analysis, the validity and reliability of conclusions derived from hypothesis testing depend on several crucial assumptions. One of the most important assumptions is the Homogeneity of Variance, which requires that the variance of the data in every studied population must be equal. This assumption is a necessary condition for widely used statistical tests, such as the t-test for comparing the means of two populations and F-test for comparing the means of three or more populations. Statisticians have developed several testing methods to verify this assumption. Traditional methods like Bartlett’s test are well-known for having high efficiency when the data follow a normal distribution but are extremely sensitive to violations of normality. Consequently, other tests with greater robustness have been proposed, such as Levene’s test (in both mean-based and median-based forms), the Non-parametric Levene’s test, O'Brien’s test, and the Fligner-Killeen test, each of which has different characteristics and efficiency depending on the nature of the data, such as skewness, kurtosis, and sample size.Currently, real-world data are often more complex than a single probability distribution, frequently appearing in the form of a mixture distribution. The mixture normal distribution is a very common probability distribution found in empirical research, such as in financial markets, medicine, and epidemiology. Using standard normal models is therefore insufficient for explaining these data. Studying the efficiency of homogeneity of variance tests under mixture distributions is critically necessary. This research, therefore, aims to study and compare the efficiency of six homogeneity of variance tests: Bartlett’s test, Mean-based Levene’s test, Median-based Levene’s test, Non-parametric Levene’s test, O'Brien’s test, and the Fligner-Killeen test, focusing on three population groups under a two-component mixture normal distribution, and considering the Type I error probability and statistical power criteria across various simulated situations.
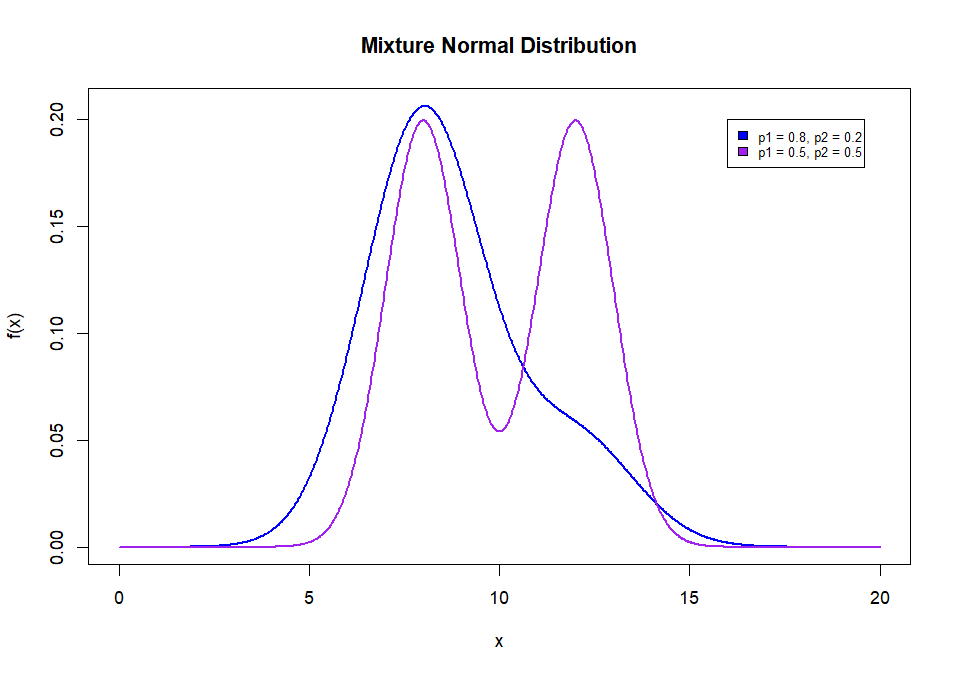
Methodology: Data for the three groups were generated from a two-component mixture normal distribution with mixing proportions (p ) were p=0.5 and p=0.8. The mean for all three groups was set to 8.8 with initial variances specified at 5, 10, and 20. Equal sample sizes were assigned to every group as (10,10,10), (20,20,20), (40,40,40), (60,60,60), (80,80,80), and (100,100,100). The variance ratios were set at 1:1:1, 1:1:2, 1:1:4 and 1:2:4. To consider the ability to control Type I error, Bradley’s liberal criterion was used at a significance level of 0.05. A test considered capable of controlling type I error must have an estimated type I error probability within the range of [0.025, 0.075]. In considering statistical power, only tests that passed Bradley’s criterion were considered; an efficient test must have an estimated statistical power of not less than 0.80, and the method with the highest value is considered the most efficient.
Main Results: The study demonstrates that the efficiency of all six testing methods differs depending on the mixing proportion and sample size. When considering the ability to control type I error: in the case where p=0.8 , the Median-based Levene’s test, Non-parametric Levene’s test, O’Brien’s test, and Fligner-Killeen test were robust, being able to control Type I error across all sample sizes, while Bartlett’s test required a sample size of 60 or more to maintain control. The Mean-based Levene’s test could not control the error in any situation. In the case where p=0.5 , the Median-based Levene’s test, Non-parametric Levene’s test, and O’Brien’s test could control Type I error across all sample sizes. The Mean-based Levene’s test began to maintain control when . However, Bartlett’s test and the Fligner-Killeen test could not control the error under this mixing proportion. In considering the estimated statistical power, only tests that could control Type I error were examined. It was found that the estimated statistical power increases according to sample size and the difference in variances. At p=0.8 : All four methods capable of controlling Type I error required a sample size of
for the 1:1:2 ratio and
for the 1:1:4 ratio to achieve statistical power higher than 0.8. Bartlett’s test provided the highest statistical power in conditions where it could control Type I error. At p=0.5, O’Brien’s test was the most prominent, providing statistical power higher than 0.8 when
at a 1:1:2 ratio and
at a 1:1:4 ratio, which outperformed all forms of Levene’s test.
Conclusions : The results of this study: 1. Bartlett’s Test: Although highly efficient in some conditions ( p=0.8 and large sample size), it cannot control Type I error when the data have a mixture distribution with equal mixing proportions, making it a high risk for application with complex data. 2. Mean-based Levene’s Test: Highly sensitive to mixing proportions and only applicable when the mixture distribution is balanced and the sample size is moderate or larger. 3. Fligner-Killeen Test: Performs well only in cases where the mixing proportion p=0.8 . 4. O’Brien’s Test: This method is identified as the most suitable and efficient overall. It not only successfully controlled the Type I error under all studied conditions but also provided the highest statistical power in nearly every scenario, particularly with small to moderate sample sizes.
References
Arsham, H., & Lovric, M. (2011). Bartlett’s Test. In: Lovric, M. (eds) International Encyclopedia of Statistical Science. Springer, Berlin, Heidelberg. https://doi.org/10.1007/978-3-642-04898-2_132.
Bartlett, M. S. (1937). Properties of Sufficiency and Statistical Tests. Proceedings of the Royal Society of London. Series A, Mathematical and Physical Sciences, 160(901), 268–282. http://www.jstor.org/stable/96803
Bongbeebina, C, & Rahman, M. (2025). ASSESSING HOMOGENEITY: A COMPARATIVE STUDY FOR ROBUST STATISTICAL ANALYSIS. Far East Journal of Mathematical Sciences (FJMS), 142(2), 139-171. https://doi.org/10.17654/0972087125009
Bradley, J. V. (1978). Robustness? British Journal of Mathematical and Statistical Psychology, 31(2), 144–152.
Brown, M. B., & Forsythe, A. B. (1974). Robust Tests for the Equality of Variances. Journal of the American Statistical Association, 69(346), 364–367. https://doi.org/10.2307/2285659
Chang, C. H., Pal, N., & Lin, J. J. (2017). A revisit to test the equality of variances of several populations. Communications in Statistics - Simulation and Computation, 46(8), 6360–6384. https://doi.org/10.1080/03610918.2016.1202277
Cohen, J. (1988). Statistical Power Analysis for the Behavioral Sciences (2nd ed.). Hillsdale, NJ: Lawrence Erlbaum Associates, Publishers.
Fligner, M. A., & Killeen, T. J. (1976). Distribution-Free Two-Sample Tests for Scale. Journal of the American Statistical Association, 71(353), 210–213. https://doi.org/10.2307/2285771
Gibbons, R. D., Dorus, E., Ostrow, D. G., Pandey, G. N., Davis, J. M., & Levy, D. L. (1984). Mixture distributions in psychiatric research. Biological psychiatry, 19(7), 935–961.
Hatchavanich, D. (2018). A Comparison of Type I Error and Power of Parametric Statistics and Nonparametric Statistics for Homogeneity of Variance Test. Asian Health, Science and Technology Reports, 26(1), 106–117. https://ph03.tci-thaijo.org/index.php/ahstr/article/view/1771
Katsileros, A., Antonetsis, N., Mouzaidis, P., Tani, E., Bebeli, P. J., & Karagrigoriou, A. (2024). A comparison of tests for homoscedasticity using simulation and empirical data. Communications for Statistical Applications and Methods, 31, 1-35. https://doi.org/10.29220/csam.2024.31.1.001
KOCA, M. B, KILIÇ, M. B, & ŞAHİN, Y (2019). Assessing wind energy potential using finite mixture distributions. Turkish Journal of Electrical Engineering and Computer Sciences, 27(3), 2276-2294. https://doi.org/10.3906/elk-1802-109
Levene, H. (1960) Robust Tests for Equality of Variances. In: Olkin, I., Ed., Contributions to Probability and Statistics, Stanford University Press, Palo Alto, 278-292.
Marozzi, M. (2011). Levene type tests for the ratio of two scales. Journal of Statistical Computation and Simulation, 81(7), 815–826. https://doi.org/10.1080/00949650903499321
Nordstokke, D. W., & Zumbo, B. D. (2010). A new nonparametric Levene test for equal variances. Psicológica, 31(2), 401–430.
O'Brien, R. G. (1981). A simple test for variance effects in experimental designs. Psychological Bulletin, 89(3), 570–574. https://doi.org/10.1037/0033-2909.89.3.570
Parra-Frutos, I. (2013). Testing homogeneity of variances with unequal sample sizes. Computational Statistics, 28, 1269–1297. https://doi.org/10.1007/s00180-012-0353-x
Rayat, C.S. (2018). Variance-Ratio Test and Analysis of Variance (ANOVA). In: Statistical Methods in Medical Research. Springer, Singapore. https://doi.org/10.1007/978-981-13-0827-7_12
Sharma, D., & Kibria, B. M. G. (2013). On some test statistics for testing homogeneity of variances: a comparative study. Journal of Statistical Computation and Simulation, 83(10), 1944–1963. https://doi.org/10.1080/00949655.2012.675336
Soikliew, K., & Araveeporn, A. (2018). Modifications of Levene’s and O’Brien’s Tests for Testing the Homogeneity of Variance Based on Median and Trimmed Mean. Thailand Statistician, 16(2), 106–128. https://ph02.tci-thaijo.org/index.php/thaistat/article/view/135555
Vorapongsathorn, T., Taejaroenkul, S., & Viwatwongkasem, C. (2004). A comparison of type I error and power of Bartlett’s test, Levene’s test and Cochran’s test under violation of assumptions. Songklanakarin Journal of Science and Technology, 26(4).
Wang, H. (2023). Tolerance limits for mixture-of-normal distributions with application to COVID-19 data. WIREs Computational Statistics, 15(6), e1611.https://doi.org/10.1002/wics.1611
Wang, J., & Taaffe, M. R. (2015). Multivariate Mixtures of Normal Distributions: Properties, Random Vector Generation, Fitting, and as Models of Market Daily Changes. INFORMS Journal on Computing, 27(2), 193-203. https://doi.org/10.1287/ijoc.2014.0616
Wang, Y., Rodríguez de Gil, P., Chen, Y.-H., Kromrey, J. D., Kim, E. S., Pham, T., Nguyen, D., & Romano, J. L. (2017). Comparing the Performance of Approaches for Testing the Homogeneity of Variance Assumption in One-Factor ANOVA Models. Educational and Psychological Measurement, 77(2), 305-329. https://doi.org/10.1177/0013164416645162
Yan, H., & Han, L. (2019). Empirical distributions of stock returns: Mixed normal or kernel density?. Physica A: Statistical Mechanics and its Applications, 514, 473-486. https://doi.org/10.1016/j.physa.2018.09.080
Yonar, A., Yonar, H., Demirsöz, M., & Tekindal, M. A. (2024). A COMPARATIVE ANALYSIS FOR HOMOGENEITY OF VARIANCE TESTS. Journal of Science and Arts, 24(2), 305-328. https://doi.org/10.46939/j.sci.arts-24.2-a06
Downloads
Published
How to Cite
Issue
Section
License
Copyright (c) 2026 Faculty of Science, Burapha University

This work is licensed under a Creative Commons Attribution-NonCommercial-NoDerivatives 4.0 International License.
Burapha Science Journal is licensed under a Creative Commons Attribution-NonCommercial-NoDerivatives 4.0 International (CC BY-NC-ND 4.0) licence, unless otherwise stated. Please read our Policies page for more information