
Factors Correlated with Hotspot Occurrences and a Monthly Forecasting Model for Hotspot Occurrences in the Upper Northern Region of Thailand
Keywords:
hotspot, the upper northern region, forecasting modelAbstract
Background and Objectives : The upper northern provinces of Thailand have been facing problems due to the continuous occurrence of hotspots every year. These hotspots are caused by a combination of various factors, including both natural factors and human activities. Studying the relationship between land use and seasonal factors, and the number of hotspots is crucial for identifying the root causes of the problem. Additionally, developing a forecasting model for monthly hotspot occurrences can help predict hotspot occurrences in the upper northern provinces of Thailand. Such information will enable relevant agencies to formulate policies, plan strategies, and implement timely management actions to mitigate the impacts of hotspot situations in the area effectively.
Methodology : This study collected data on the number of hotspots in forest and agricultural areas across eight provinces in the upper northern region of Thailand, namely Chiang Mai, Chiang Rai, Lampang, Lamphun, Mae Hong Son, Nan, Phrae, and Phayao, from January 1, 2018, to December 31, 2024. The data were obtained from MODIS sensors through the data accounting system of the Royal Forest Department. To study the relationship between land use and seasonal factors and the number of hotspots, the hotspot data were classified by land use factors into three areas of interest: national reserved forests, conservation forests, and agricultural areas. The data were also classified by season into three categories: rainy season (May–October), winter season (November–February), and summer season (March–April). The analysis was conducted on monthly hotspot data from 2018 to 2024, classified by land use and seasonal factors. The relationships between these factors and the number of hotspots in each district of the upper northern provinces were analyzed using the chi-square test. For the forecasting study of hotspot occurrences, the time series components of hotspot data were tested using the Runs Test and the Kruskal–Wallis Test. The data were divided into two sets. Set 1 consisted of hotspot data from January 2018 to December 2023 for constructing forecasting models using three methods: regression analysis with dummy variables, classical decomposition method, and Holt–Winters exponential smoothing method. Set 2 consisted of hotspot data from January 2024 to December 2024 for evaluating the forecasting accuracy of each model developed from Set 1, using Mean Absolute Deviation (MAD) and Root Mean Square Error (RMSE) as evaluation criteria.
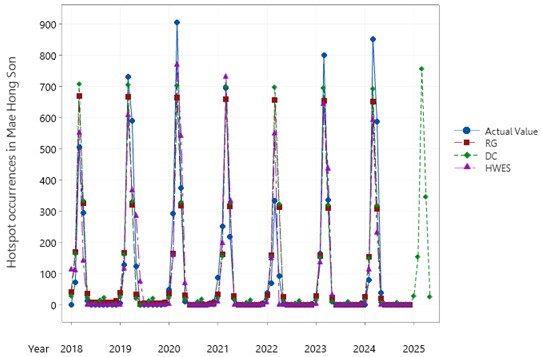
Main Results : The analysis of hotspot occurrences from 2018 to 2024 revealed that Chiang Mai had the highest number of hotspots, accounting for 21.38% of the total hotspots in the study area, followed by Mae Hong Son (20.61%), Chiang Rai (16.87%), and Nan (14.34%). When analyzing the relationship between land use and seasonal factors and the number of hotspots in each district using the chi-square test at a 0.05 significance level, it was found that both land use and seasonal factors were significantly associated with the number of hotspots in each district. Most districts in the upper northern provinces experienced the highest number of hotspots in forest areas, except for Mae Lao, Mae Chan, Pa Daet, and Mae Sai districts in Chiang Rai province; Dok Khamtai, Chun, and Phu Kamyao districts in Phayao province; Mueang Lamphun and Pa Sang districts in Lamphun province; and Nong Muang Khai district in Phrae province, where the highest number of hotspots occurred in agricultural areas. At the provincial level, all provinces recorded the highest number of hotspots in forest areas. Nan, Chiang Rai, Chiang Mai, Lampang, and Phrae had the highest number of hotspots in national reserved forests, while Phayao, Lamphun, and Mae Hong Son had the highest number in conservation forests. The summer season recorded the highest number of hotspots in every district of each province. In Chiang Mai, Nan, Mae Hong Son, Phayao, Phrae, Lampang, and Lamphun, March was the month with the highest number of hotspots, except for Chiang Rai, where April had the highest number. The selection of forecasting models was based on the lowest MAD and RMSE. The regression model with dummy variables was the most suitable for forecasting hotspot occurrences in Lampang and Lamphun provinces. The classical decomposition method was suitable for Chiang Mai and Mae Hong Son, while the Holt–Winters exponential smoothing method was appropriate for Nan, Chiang Rai, Phayao, and Phrae. When forecasting hotspot occurrences from January to May 2025 using the most effective model for each province, it was found that Nan, Chiang Mai, Phayao, Mae Hong Son, Phrae, Lampang, and Lamphun were projected to have the highest number of hotspots in March, whereas Chiang Rai was projected to have the highest number in April.
Conclusions : The top four provinces with the highest number of hotspot occurrences during 2018–2024 were Chiang Mai, Mae Hong Son, Chiang Rai, and Nan, respectively. The analysis indicated that the number of hotspots in all districts was associated with land use and seasonal factors. It was found that most districts in the upper northern provinces had a high number of hotspots in forest areas. At the provincial level, all provinces showed the highest number of hotspots in forest areas and the lowest in agricultural areas. Regarding seasonal factors, both district-level and provincial-level analyses revealed that the number of hotspots was highest in the summer season, followed by winter and then the rainy season. For the forecast of hotspot occurrences from January to May 2025, all provinces were predicted to have the highest number of hotspots in March, except for Chiang Rai, which was predicted to peak in April.
References
Amnauylawjarurn, T., Kreusuwun, J., Towta, S., & Siriwittayakorn, K. (2010). Dispersion of particulate matter (PM10) from forest fires in Chiang Mai, Thailand. Chiang Mai Journal of Science, 37(1), 39-47. (in Thai)
Damsri, S., & Maneewong, K. (2017). A comparative study of forecasting models for the number of malaria Patients in Phanom district. Journal of Thai Interdisciplinary, 12(3), 1-6. https://doi.org/10.14456/jtir.2017.14
Inlaung, K., Chotamonsak, C., Surapipith, V., & Macatangay, R. (2023). Relationship of fire hotspot, PM2.5 concentrations and surrounding areas in upper northern Thailand: A case study of haze season in 2019. The Journal of King Mongkut's University of Technology North Bangkok, 33(2), 588-602. https://doi.org/10.14416/j.kmutnb.2022.07.002 (in Thai)
Maimun, P., & Charoenpanyanet, A. (2023). Creation of wildfire opportunity predictive model from climate variability with geo-informatics in Omkoi District, Chiang Mai Province. Burapha Science Journal, 28(2), 949-974. (in Thai)
Pollution Control Department. (2023). Situation and management of air and noise pollution problems in Thailand in 2023. Bangkok: Pollution Control Department. (in Thai)
Sawetsuthipan, T., & Charnsethikul, P. (2021). A comparison of forecasting methods for seasonal time-series with many zeros. Thai Journal of Operations Research, 9(2), 57–67.
https://ph02.tci-thaijo.org/index.php/TJOR/article/view/244008 (in Thai)
Suwanwong, S. (2013). Quantitative forecasting techniques: Time series. Bangkok: Mahidol University. (in Thai)
Sumethavanich, P. (2024). Climate factors and hotspots affect the amount of PM2.5 Dust in Lampang province, Thailand. Journal of Research Unit on Science, Technology and Environment for Learning, 15(1), 53-63. https://doi.org/10.14456/jstel.2024.5 (in Thai)
Thanadolmethaphorn, P., Chotamonsak, C., & Dontree, S. (2018). Analysis of impact of climate change on forest fire potential in Chiang Mai by using of regression model. The Journal of King Mongkut's University of Technology North Bangkok, 28(4), 849-858. https://doi.org/10.14416/j.kmutnb.2018.09.004 (in Thai)
Taesombut, S. (2006). Quantitative forecasting. (1st ed.). Bangkok: Kasetsart University. (in Thai)
Zea-kow, C., Rachdawong, P., & Charoenpol, K. (2022). Statistical analysis of factors affecting the onset of forest fires in Nan province. Master of Engineering Thesis, Chulalongkorn University. https://doi.org/10.58837/CHULA.THE.2020.1080 (in Thai)
Downloads
Published
How to Cite
Issue
Section
License
Copyright (c) 2025 Faculty of Science, Burapha University

This work is licensed under a Creative Commons Attribution-NonCommercial-NoDerivatives 4.0 International License.
Burapha Science Journal is licensed under a Creative Commons Attribution-NonCommercial-NoDerivatives 4.0 International (CC BY-NC-ND 4.0) licence, unless otherwise stated. Please read our Policies page for more information