
Evaluating the Efficiency of Skewness Test Statistics Based on Descriptive
Keywords:
critical values , descriptive statistics , power of the test , skewness test , Type I errorAbstract
Background and Objectives: Understanding data distribution is important for identifying outliers. Some values far from most data points may not be real outliers but may naturally occur in certain data types. Traditional boxplots may show many outliers in these cases, even when the values are normal for that data type. Knowing the distribution type and choosing the right boxplot method can help avoid these mistakes. The Ratio Skewed Boxplot method offers a more accurate and reliable approach to outlier detection. This highlights the importance of examining data distribution, particularly by assessing skewness using simple and effective methods. This study examines the efficiency of skewness test statistics derived from descriptive statistics, following Tabor (2010), who proposed eleven test statistics based on the mean, median, first and third quartiles, minimum, maximum, and standard deviation. Although these eleven test statistics were evaluated, no universal critical values can be generally applied to all datasets due to the exact mean and standard deviation of the data are unknown. For this reason, this work aims to determine appropriate critical values and compare the effectiveness of skewness test statistics derived from basic statistical measures that are easy to compute, based on Tabor's research.
Methodology: The study consists of two parts: finding critical values and evaluating efficiency based on Type I error control and power of the test at least 80%. Critical values for eleven test statistics were determined using a Monte Carlo simulation with 100,000 iterations. Data following a normal distribution were generated with sample sizes of n = 10, 20, 30, 50, 100, and 200, and the values for all test statistics were calculated. The 95th and 99th percentiles of the sampling distributions for all test statistics were identified as the critical values corresponding to significance levels of 0.05 and 0.01, respectively. This process was repeated using different parameter sets for the normal distribution, and the results were averaged for each sample size. In order to calculate the Type I error, we generated data from a standard normal distribution with 10,000 simulation replicates. All tests were performed based on the critical values provided in the first part. The Type I error rate was calculated as the proportion of rejections, determined by dividing the number of rejections by the total number of replications. Another key criterion is the power of the test. Data were simulated from three skewed distributions: the chi-square distribution, the gamma distribution, and the lognormal distribution using multiple parameter settings to represent various characteristics of the data. The test power is determined by the probability of rejecting the null hypothesis. A test statistic with the highest power is considered the most efficient.
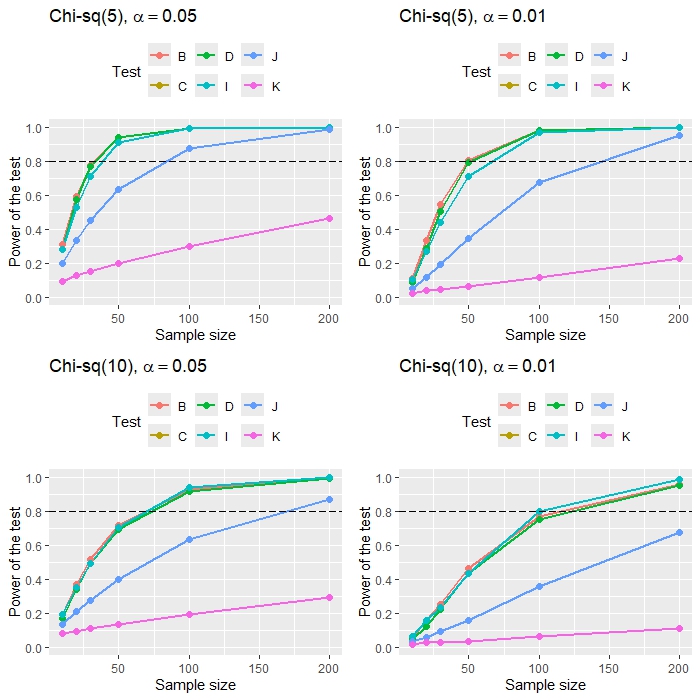
Main Results: The critical values of the test statistics obtained from certain experimental methods are applicable due to their derivation through data simulation using nine parameter settings. It is observed that if the test statistics derived from all parameter sets are similar, the averaged critical values will be appropriate and enable the test statistics to effectively control Type I error. The results indicate that Type I error rates for most skewness test statistics fall within Bradley’s liberal Type I error range. This range is (0.025, 0.075) for a 0.05 significance level and (0.005, 0.015) for a 0.01 significance level across all sample sizes. This means that they are close to the significance level. In other words, most test statistics have been proven to be efficient methods. Next, we considered only test statistics that effectively control Type I error and compared their power of the test. It can be seen that test statistics B, D, and I, as shown in Table 1, exhibit the highest power and achieve at least 80% power of the test when the sample size is large. Additionally, their efficiency depends on the skewness coefficient of the data. The results exhibit a consistent pattern across all studied data distributions, including the chi-square distribution, the gamma distribution, and the lognormal distribution.
Conclusions: The power of the test for the three best methods depends on the shape of the distribution and the sample size. A highly skewed distribution gives strong power of the test, over 80%, even with a small sample. In contrast, less skewed distributions require larger samples to achieve a test power of 0.80. This study suggests that the test statistics can be effective when the sample size is sufficiently large, ensuring the test meets the 80% threshold and accurately detects skewness. Additionally, the three test statistics were applied to real data, specifically wind speed data from two locations in Thailand: the Nakhon Ratchasima Meteorological Station and the Chaiyaphum Meteorological Station. The study analyzed 100 wind speed data points collected between March 1, 2023 and June 8, 2023. The data were used to create histograms to examine the distribution characteristics. Then, the three skewness test statistics were applied to the data. The results were consistent across all three methods, indicating that the wind speed data from both stations exhibit a skewed distribution.
References
Bradley, J. V. (1978). Robustness? British Journal of Mathematical and Statistical Psychology, 31(2), 144–162.
Cohen, J. (1988). Statistical Power Analysis for the Behavioral Sciences (2nd ed.). Hillsdale, NJ: Lawrence Erlbaum Associates, Publishers.
Özkan, R., Sen, F. , & Ballı, S. (2020). Evaluation of wind loads and the potential of Turkey's south west region by using log-normal and gamma distributions. Wind Struct., 31(4), 299–309.
Safari, B. (2011). Modeling wind speed and wind power distributions in Rwanda. Renewable and Sustainable Energy Reviews, 15(2), 925–935.
Tabor, J. (2010). Investigating the investigative task: Testing for skewness. Journal of Statistics Education, 18(2), 1–13.
Walker, M. L., Dovoedo, Y. H., Chakraborti, S. , & Hilton, C. W. (2018). An Improved Boxplot for Univariate Data. The American Statistician, 72(4), 1–13.
Downloads
Published
How to Cite
Issue
Section
License
Copyright (c) 2025 Faculty of Science, Burapha University

This work is licensed under a Creative Commons Attribution-NonCommercial-NoDerivatives 4.0 International License.
Burapha Science Journal is licensed under a Creative Commons Attribution-NonCommercial-NoDerivatives 4.0 International (CC BY-NC-ND 4.0) licence, unless otherwise stated. Please read our Policies page for more information

